The US Dollar Index reached an 11 month high, breaking through the 80 barrier yesterday and staying above that level today. The bulls are in firm control over the dollar even as "The Great Deflation" inexorably regains the upper hand in gold, oil, stocks, and housing after a 2 year bear market rally from March 2009 to May 2011.
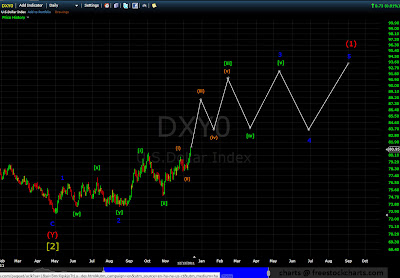
Here is an updated chart of the US Dollar Index starting from the low of Primary wave [2] down (2008 - 2011) and the rally so far from the low:
The primary count is that the dollar is approaching the center of Intermediate wave (1) of Primary wave [3] up, which could explain the break-out advance that has started to unfold over the last month. This scenario is hinting that we are close to reaching an Intermediate degree point of recognition in which analysts and economists will start to realize that the dollar is trending upwards.
Here is a chart of the US Dollar Index since the low in 2008, which shows part of a Cycle degree advance in progress:
The upside target of Intermediate wave (1) of Primary wave [3] in the US Dollar Index is around 93, to be reached in September 2012. The upside target takes the dollar beyond the peak of Primary wave [1] up.
Here is a chart of the US Dollar Index, showing the projected wave path of the dollar through the rest of "The Great Deflation". The advance from the low in 2008 is Cycle wave I up, projected to end in 2021 with an upside target of around 185.
The US Dollar Index is an important part of "The Great Deflation" picture. While the US Dollar Index is in a bullish uptend, stocks, commodities, the economy, and job market are declining during the same time interval. Here is how the dollar fits into the overall picture:
1 -- The Cycle degree advance in the dollar from 2008 to 2021 lasts a fibonacci 13 years. The advance was preceded by a 32 year bearish ending diagonal. The 13 year duration for Cycle wave I up in the dollar also fulfills the guideline that ending diagonals are retraced in the opposite direction in one-third to one-half of the time. This strongly argues for "The Great Deflation" ending in 2021. Cycle wave I up in the US Dollar Index strongly corresponds to Cycle wave c down in the DJIA, S&P 500 and the Wilshire 5000.
2 -- Most of the global debt is denominated in US dollars. During the massive credit bubble that unfolded during Cycle wave V up (1974 - 2000), the dollar was relentlessly devalued relative to other currencies on the planet as the credit bubble expanded. At the height of the credit bubble, there was an estimated 1 quadrillion (that is 10^15) dollars in debt throughout the globe. Now that the credit bubble is imploding, the US dollar is rising in value again as phantom money (which is mostly dollars) disappears into thin air.
As "The Great Deflation" starts unfolding in full force, the US Dollar Index will accelerate upwards. Primary wave [3] up in the US Dollar Index strongly corresponds to Primary wave [3] down in the DJIA, S&P 500, and the Wilshire 5000. As we are approaching the center of Intermediate wave (1) of Primary wave [3] up in the dollar, the overall sentiment on the dollar in the mainstream media is something to keep an eye on in the coming weeks.


No comments:
Post a Comment